


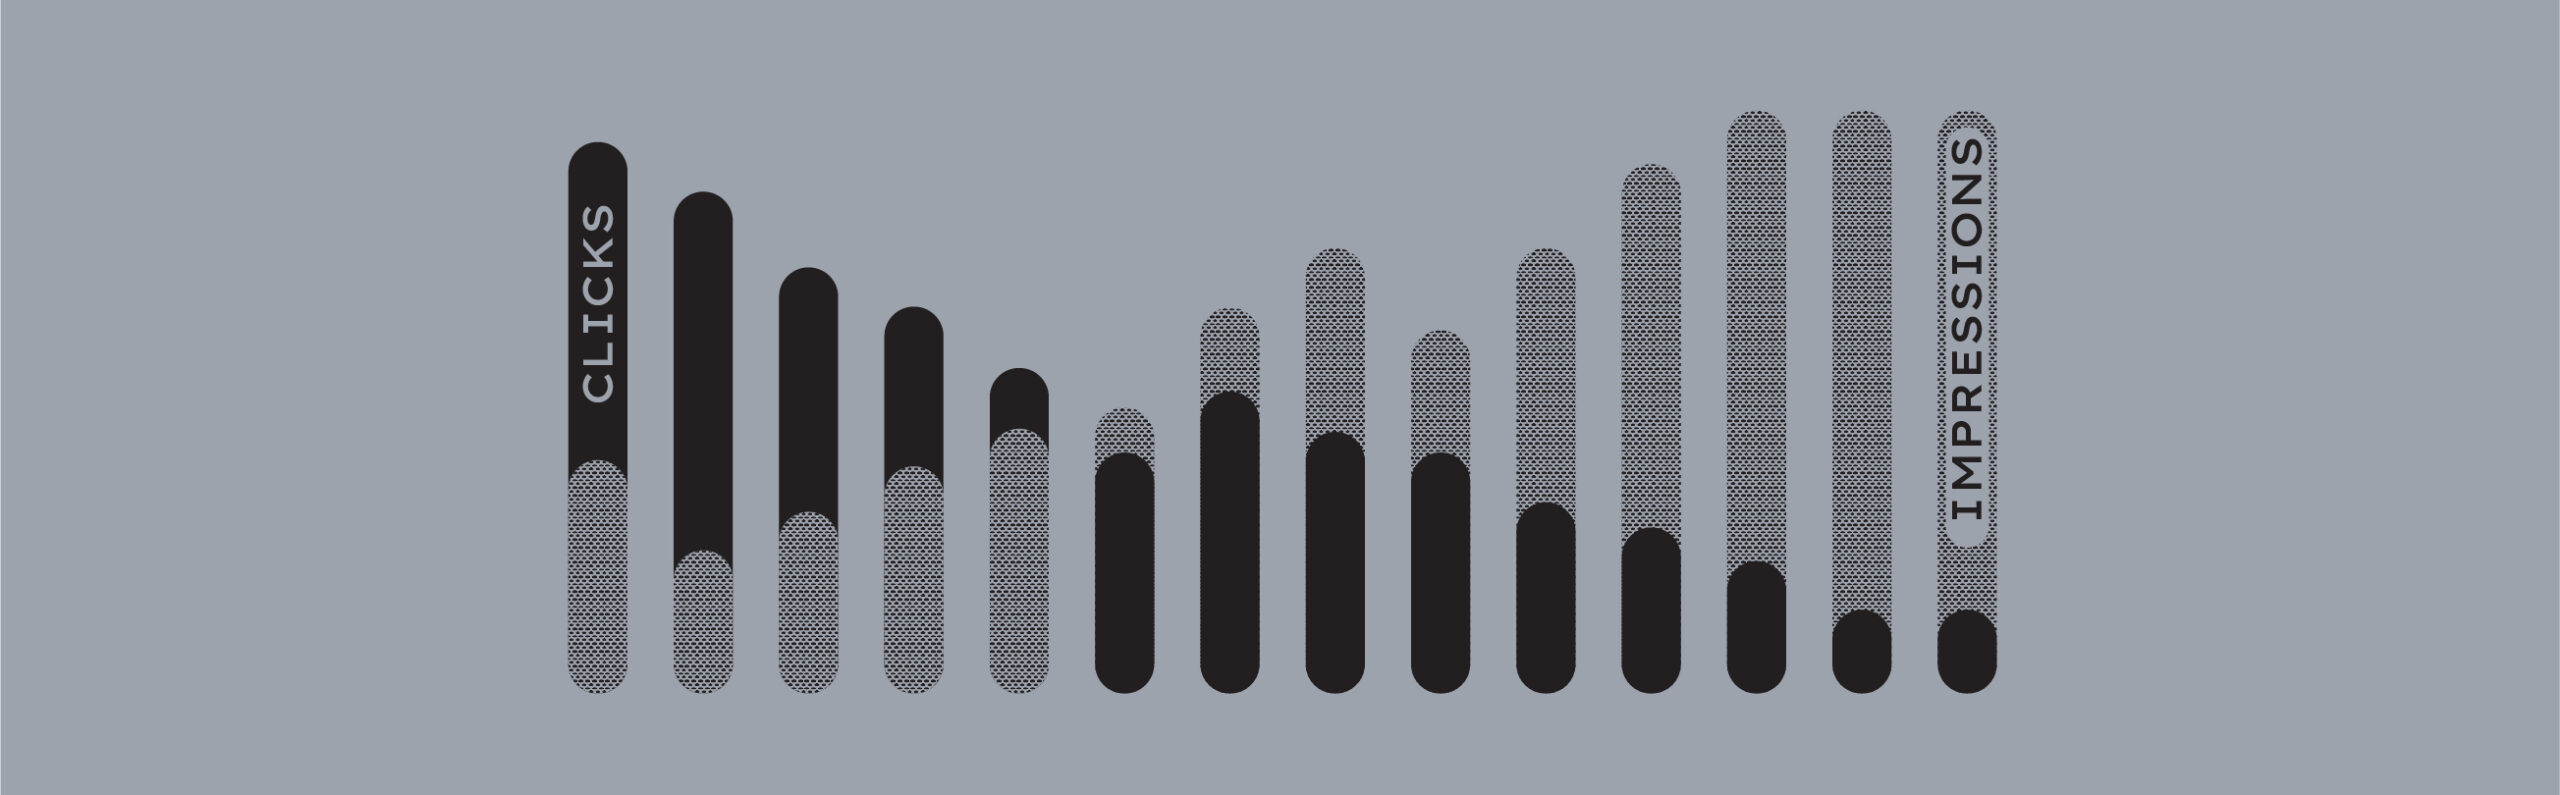
Google now places an AI-generated summary above the organic results on more than half of real user searches.
That change creates a measurement problem. While people are still finding your business through search, they’re not always clicking through to your website. Instead, they read a summarized version of your content, compare you against two or three competitors, and decide whether or not your business is worth contacting on the search results page (SERP), where none of your tracking code can see it.
As a result, the searcher arrives on your website later in the buying process, often through a branded search or a direct URL entry, and your analytics platform files it under something other than organic search. Sessions and clicks fall. Rankings may be steady. Revenue is often flat or improves. The report and the business tell you two different stories.
When it comes to AI search and SEO, you have to change the way you’re measuring success. Stop measuring traffic volume in clicks and sessions, and start measuring it by the leads and revenue it produces.
Below is what has changed, why it distorts standard reporting, and a step-by-step process for building tracking that ties a search query to a signed contract or purchased product.
What Changed in Search Results and Why Traffic Reports Look Worse
If it feels like your search traffic is in the red, stop panicking. Search is just changing (again).
Three things happen when an AI summary sits above your listing:
- Informational queries stop producing visits. Questions your blog posts used to answer get resolved on the results page, especially for queries like definitions, or any query that can be answered in a sentence or short paragraph.
- Research moves off your site. Comparison, pricing context, and shortlisting happen inside the summary or inside a chat assistant. Users are letting their AI agents do the scouting for them.
- The click that leads to a sale goes from “organic” to “direct” or “(not set)”. Someone who read about you in a summary on Tuesday and typed your company name into the address bar on Friday shows up as direct or branded traffic.
So, this doesn’t mean that organic search is producing less business. It just means the visible part of the process shrank, and the part your analytics can measure shrank with it.
Why Fewer Clicks Does Not Mean Less Revenue From Search
The clicks that still arrive are worth considerably more than they used to be.
Adobe Digital Insights published its quarterly AI traffic report in April 2026, drawing on more than a trillion visits to U.S. retail sites. In March 2026, visitors who arrived from AI sources converted 42% better than visitors from all other channels. Twelve months earlier, that same traffic converted worse than average. Adobe also recorded 37% more revenue per visit, 48% more time on site, and 13% more pages viewed among AI-referred visitors.
In other words, a searcher who clicks on your website after reading an AI Overview has already ruled out several options and knows roughly what they want. They land on your page closer to a decision than a visitor who clicked the third blue link out of curiosity.
For most mid- to large-sized businesses, the pattern now looks like this:
- Fewer sessions and clicks
- Higher intent per session
- Longer gaps between first exposure and first contact
- More conversions credited to direct, branded, or referral traffic
Any reporting system built on session counts reads that as a decline, but tracking systems built on outcomes read it correctly.
Where does Your SEO Tracking Fail?
Before you overhaul your tracking system, you should know which specific failures create confusion:
- Last-click attribution. Credit goes to the final touch, which is usually branded search or direct.
- Short cookie windows. A 30-day window cannot span a 90-day sales cycle.
- Untracked phone calls. For service businesses, this alone can account for most of the pipeline.
- No offline conversion data. You can count leads but not revenue, so cheap unqualified leads look like a win.
- Missing source fields on forms. The lead lands in the CRM with no record of how it got there.
How to Build Closed-Loop Tracking From Search Query to Closed Sale
Building a solid closed-loop tracking pipeline takes a few weeks of setup, but it pays for itself the first time you have to defend a budget or make an important strategic decision. Here’s a step-by-step guide.
Step 1: Define Your Conversion Events and Assign Each One a Dollar Value
List every action on your site that signals buying intent. For most businesses that includes:
- Quote and estimate requests
- Phone calls over 60 seconds
- Demo or consultation bookings
- Service scheduling
- Financing or application submissions
Keep newsletter signups and content downloads on a separate list so they do not inflate your lead counts.
Then attach a value to each event using your historical numbers. If 12% of quote requests close at an average of $18,000, a quote request is worth roughly $2,160. Approximate figures are fine. Having a number beats having none.
Step 2: Capture Traffic Source Data on Every Form Submission
Add fields to every form that automatically record:
- Original traffic source and medium
- Campaign and referring URL
- First landing page
- Most recent landing page
- Date of first site visit
Set the first-touch cookie to at least 90 days, and longer if your sales cycle runs long. These fields should populate automatically and stay invisible to the person filling out the form. Most CMS and form platforms support this natively, and the rest can be handled with a short script in your tag manager.
This one step recovers more attribution than anything else on the list. When a prospect finds you in March through a summarized answer, returns in June by typing your URL, and submits a form in July, the form still carries the March organic touch.
Step 3: Set Up Call Tracking With Dynamic Number Insertion
If the phone drives revenue in your business, untracked calls will distort every number you report.
- Use dynamic number insertion so the number on the page changes based on how the visitor arrived
- Set a minimum call duration to filter out wrong numbers and vendor calls
- Route call records into the same system that holds your form submissions
- Record and score calls if you want lead quality data by channel
Step 4: Connect Your CRM and Send Closed-Won Revenue Back to Your Analytics
Every lead should reach the CRM with its source fields intact. Then send the outcome back the other direction. When a deal closes, that revenue needs to return to GA4 and your ad platforms, such as Google Ads, as an offline conversion.
Most CRMs support this through native integrations or a scheduled upload. Without the return trip you can measure lead volume but never lead value, and lead volume alone will push budget toward whichever channel produces the most inexpensive inquiries.
Step 5: Add a “How Did You Hear About Us?” Field to Your Primary Forms
Digital attribution will always undercount word of mouth, AI assistants, podcasts, and print. A required self-reported field on your main conversion form can help.
- Keep the option list short and specific to your business
- Include an option for AI assistants such as ChatGPT, Gemini, or Perplexity
- Compare self-reported answers against tracked data across a few hundred leads
The difference between the two datasets tells you how much demand your model is missing.
Step 6: Build a Branded Search Baseline in Google Search Console
Pull 16 months of branded query data and chart impressions and clicks separately.
Branded search volume is the closest thing you have to a demand meter. When people encounter your name in a summary and never click, their next move is often to search for your company directly. Rising branded impressions during a period of falling non-branded clicks tells you visibility is working even though the traffic report disagrees.
Step 7: Rebuild Your Monthly Marketing Report Around Revenue Metrics
Lead with four numbers per channel:
- Leads generated
- Qualified leads
- Closed revenue
- Cost per acquisition
Move sessions, rankings, and impressions to an appendix where they belong as diagnostics. The first time you present the report this way, expect questions. By the second month, expect a much better conversation about where the budget should go.
Leading Indicators to Track Between Reporting Cycles
Revenue attribution tells you what already happened. These signals tell you what is coming, usually one to three months ahead of the revenue line.
- Branded search impressions and volume. The earliest reliable indicator of demand.
- Non-branded impressions and average position. Climbing impressions with flat clicks means you are gaining visibility in an zero-click environment.
- Referral traffic from AI platforms. Segment ChatGPT, Gemini, Perplexity, Copilot, and Claude in your analytics. The session counts will look trivial. Look at the conversion rate and revenue per session instead.
- Citation frequency in AI answers. Track how often your brand appears for the 20 to 30 questions that matter most in your category. Log the results monthly or use a monitoring tool.
- Direct traffic to deep pages. Direct visits to your homepage mean people remember your name. Direct visits to a specific service page mean someone read about that exact service somewhere and came back for it.
- Lead quality by source. Close rate, average deal size, and sales cycle length, segmented by original channel.
- Assisted conversions. In GA4, review conversion paths where organic appears anywhere other than the last step.
How to Know It’s Tracking 90 Days After Setup
Once the system runs for a full quarter, you should be able to answer these questions without guessing:
- How many leads did organic search produce last month, including phone calls?
- What percentage of those leads were qualified?
- How much closed revenue can be traced back to an organic first touch?
- What did each acquired customer cost by channel?
- Is branded search demand rising or falling?
If you can answer all five, a decline in sessions becomes a data point rather than a crisis, and you will know whether it matters.
Still Wondering About AI Search Optimization?
Search still drives demand for your business, but it’s harder to track than it once was. We can help you build a system that tracks the most relevant metrics, reports on leads and revenue instead of traffic, and watches branded search and AI citations as your early warning system.
Contact us at Astute Communications today for a no-pressure consultation and learn how we can help.